
|
plotjuggler package from plotjuggler repoplotjuggler |
ROS Distro
|
Package Summary
| Version | 3.16.0 |
| License | MPL-2.0 |
| Build type | CATKIN |
| Use | RECOMMENDED |
Repository Summary
| Description | |
| Checkout URI | https://github.com/facontidavide/PlotJuggler.git |
| VCS Type | git |
| VCS Version | main |
| Last Updated | 2026-03-18 |
| Dev Status | DEVELOPED |
| Released | RELEASED |
| Contributing |
Help Wanted (-)
Good First Issues (-) Pull Requests to Review (-) |
Package Description
Additional Links
Maintainers
- Davide Faconti
Authors
- Davide Faconti

![]()
![]()
![]()
![]()
![]()

Gold Sponsor:


PlotJuggler 3.16
PlotJuggler is a tool to visualize time series that is fast, powerful and intuitive.
Noteworthy features:
- Simple Drag & Drop user interface.
- Load data from file.
- Connect to live streaming of data.
- Save the visualization layout and configurations to reuse them later.
- Fast OpenGL visualization.
- Can handle thousands of timeseries and millions of data points.
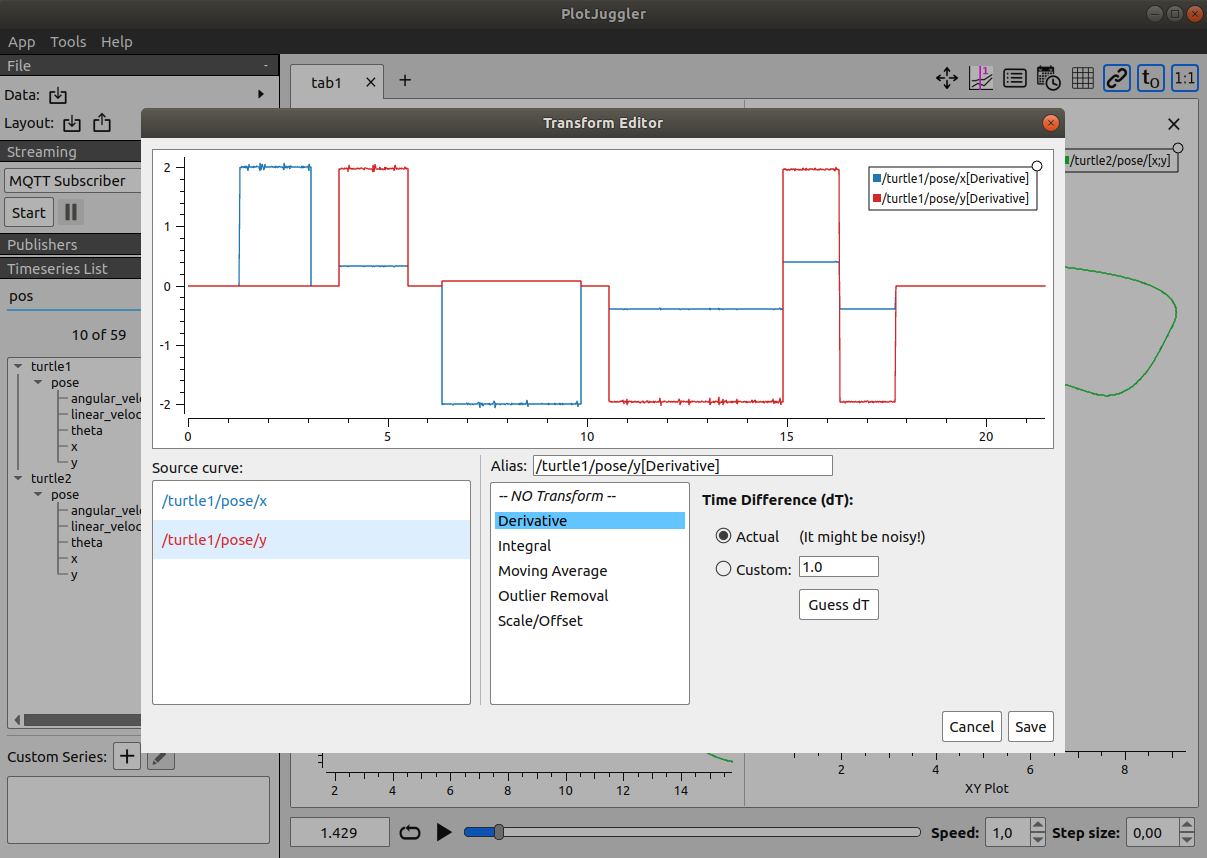
- Transform your data using a simple editor: derivative, moving average, integral, etc…
- PlotJuggler can be easily extended using plugins.
Data sources (file and streaming)
- Load CSV files.
- Load ULog (PX4).
- Subscribe to many different streaming sources: MQTT, WebSockets, ZeroMQ, UDP, etc.
- Understand data formats such as JSON, CBOR, BSON, Message Pack, etc.
- Well integrated with ROS: open rosbags and/or subscribe to ROS topics (both ROS1 and ROS2).
- Supports the Lab Streaming Layer, that is used by many devices.
- Easily add your custom data source and/or formats…

Transform and analyze your data
PlotJuggler makes it easy to visualize data but also to analyze it. You can manipulate your time series using a simple and extendable Transform Editor.
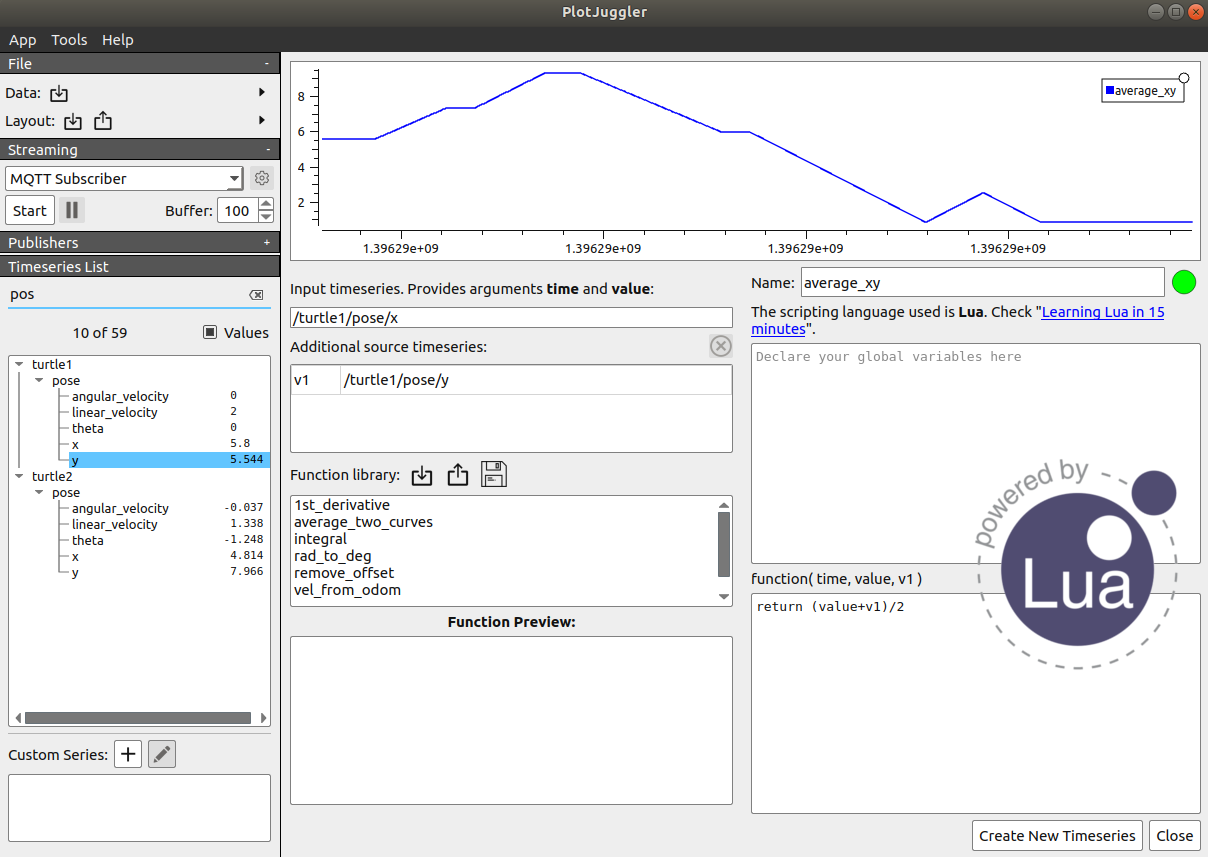
Alternatively, you may use the Custom Function Editor, which allows you to create Multi-input / Single-output functions using a scripting language based on Lua.
If you are not familiar with Lua, don’t be afraid, you won’t need more than 5 minutes to learn it ;)
Tutorials
To learn how to use PlotJuggler, check the tutorials here:
| Tutorial 1 | Tutorial 2 | Tutorial 3 |
|---|---|---|
 |
 |
 |
Supported plugins
Some plugins can be found in a different repository. The individual README files should include all the information needed to compile and use the plugin.
Please submit specific issues, Pull Requests and questions on the related Github repository:
If you want a simple example to learn how to write your own plugins, have a look at PlotJuggler/plotjuggler-sample-plugins
Installation
You can download the latest ready to use binaries from the Release page.
Snap (recommended in Ubuntu, to ROS users too)
The snap contains a version of PlotJuggler that works (with some limitations) with ROS2.

To install it in Ubuntu, run:
File truncated at 100 lines see the full file
Changelog for package plotjuggler
3.16.0 (2026-03-10) -----------* add plotjuggler and foxglove bridge plugins * fix Windows MSVC wasmer linking * fix: timestamp detection with array fields (#1310) * Add PlotGroup support to parsing plugins (topic/channel as group) * WebSocket dialog: dedicated Connect button, sorting, and UI polish * move to wasmer * Fix: No buttons appears / Can't select any topics (#1306) * much faster MCAP pre-loading and update to 2.1.2 * Replace StringRef with dictionary index in StringSeries. Fixes #1031 * Fix dangling StringRef pointers in StringSeries::clonePoints (#1279) * Fix WebSocket plugin: use project's zstd target instead of find_path * Fix Reset to Default Curve Style in PlotWidget (#1277) * Fix multiple bugs in rosx_introspection (ported from upstream) * WebSocket DataStreamer plugin integration (#1295) * Fix: Save colorMaps section to layout XML (#1278) * Add automatic detection and merging of separate date/time CSV columns (#1259) * Support batched array messages in JSON/CBOR/BSON/MessagePack parsers (#1285) * fix: quaternion-to-RPY toolbox streaming data loss (#1289) * Topological sorting for nested dependencies in custom equations (#1300) * Fix Parsing of DiagnosticArrays (#1297) * fix: use first available parser instead of hardcoded fallback (#1015) * fix DJS_PLUGINS_DIRECTORY in Docker build (#1281) * fix: guard undo/redo from firing during active popups (#1287) * fix merging of string series (#1298) * fix: parsing of nested topics in ulogs (#1301) * fix: Arrow 23.0.0 compatibility (#1282) * fix placeholder text color (workaround to Qt5 bug) * improve clarity of nlohmann parsers dialog * Adjust dialog size based on protocol selection * fix: inherit legend settings when splitting plot views (#1260) * Fix Conan 2.x build instructions in COMPILE.md (#1256) * Contributors: Alvvalencia, Copilot, Davide Faconti, Jeremy Elson, KIRAN, Luca Bonamini, Panav, Sachin Kumar, Simon Sagmeister, Timo Stienstra, Tobias Büchli, dependabot[bot], Øyvind Taksdal Stubhaug
3.15.0 (2025-12-27)
3.14.6 (2025-12-27)
- cherry pick #835: use timspam in protobuf, if present
- formatting
- fix style in preferences
- Feature: add option to swap pan/zoom mouse actions (#1235)
- cleanup ULG plugin
- Merge branch 'he_parse'
- fix formatting
- fix comments
- CSV parsing: fix issue #1237
- Add hexadecimal timestamp parsing (0x prefix only) Support hexadecimal values in CSV files when explicitly prefixed with 0x. This avoids ambiguity with string labels like 'A' or 'B' which could otherwise be misinterpreted as hex values. Addresses feedback from \@facontidavide on #1227
- Fix plugin installation path from /usr/OFF to /usr/lib/plotjuggler/plugins (#1239)
- Add GitHub Copilot instructions for repository context (#1242)
- add devcontainer
- should fix #1223
- formatting
- Contributors: Copilot, Davide Faconti, panav, viktor-av
3.14.5 (2025-12-22)
- add option to change width of lines in PlotWidget Editor
- fix snap build
- Contributors: Davide Faconti
3.14.4 (2025-12-19)
- change ID
- Install plugins into lib tree (#1228)
File truncated at 100 lines see the full file
Package Dependencies
| Deps | Name |
|---|---|
| catkin | |
| ament_cmake | |
| roslib | |
| roscpp | |
| ament_index_cpp | |
| rclcpp | |
| data_tamer_cpp |
System Dependencies
Dependant Packages
| Name | Deps |
|---|---|
| plotjuggler_ros |
Launch files
Messages
Services
Plugins
Recent questions tagged plotjuggler at Robotics Stack Exchange
|
|
plotjuggler package from plotjuggler repoplotjuggler |
ROS Distro
|
Package Summary
| Version | 3.16.0 |
| License | MPL-2.0 |
| Build type | CATKIN |
| Use | RECOMMENDED |
Repository Summary
| Description | |
| Checkout URI | https://github.com/facontidavide/PlotJuggler.git |
| VCS Type | git |
| VCS Version | main |
| Last Updated | 2026-03-18 |
| Dev Status | DEVELOPED |
| Released | RELEASED |
| Contributing |
Help Wanted (-)
Good First Issues (-) Pull Requests to Review (-) |
Package Description
Additional Links
Maintainers
- Davide Faconti
Authors
- Davide Faconti
![]()
![]()
![]()
![]()
![]()
Gold Sponsor:
PlotJuggler 3.16
PlotJuggler is a tool to visualize time series that is fast, powerful and intuitive.
Noteworthy features:
- Simple Drag & Drop user interface.
- Load data from file.
- Connect to live streaming of data.
- Save the visualization layout and configurations to reuse them later.
- Fast OpenGL visualization.
- Can handle thousands of timeseries and millions of data points.
- Transform your data using a simple editor: derivative, moving average, integral, etc…
- PlotJuggler can be easily extended using plugins.
Data sources (file and streaming)
- Load CSV files.
- Load ULog (PX4).
- Subscribe to many different streaming sources: MQTT, WebSockets, ZeroMQ, UDP, etc.
- Understand data formats such as JSON, CBOR, BSON, Message Pack, etc.
- Well integrated with ROS: open rosbags and/or subscribe to ROS topics (both ROS1 and ROS2).
- Supports the Lab Streaming Layer, that is used by many devices.
- Easily add your custom data source and/or formats…
Transform and analyze your data
PlotJuggler makes it easy to visualize data but also to analyze it. You can manipulate your time series using a simple and extendable Transform Editor.
Alternatively, you may use the Custom Function Editor, which allows you to create Multi-input / Single-output functions using a scripting language based on Lua.
If you are not familiar with Lua, don’t be afraid, you won’t need more than 5 minutes to learn it ;)
Tutorials
To learn how to use PlotJuggler, check the tutorials here:
| Tutorial 1 | Tutorial 2 | Tutorial 3 |
|---|---|---|
|
|
|
Supported plugins
Some plugins can be found in a different repository. The individual README files should include all the information needed to compile and use the plugin.
Please submit specific issues, Pull Requests and questions on the related Github repository:
If you want a simple example to learn how to write your own plugins, have a look at PlotJuggler/plotjuggler-sample-plugins
Installation
You can download the latest ready to use binaries from the Release page.
Snap (recommended in Ubuntu, to ROS users too)
The snap contains a version of PlotJuggler that works (with some limitations) with ROS2.
To install it in Ubuntu, run:
File truncated at 100 lines see the full file
Changelog for package plotjuggler
3.16.0 (2026-03-10) -----------* add plotjuggler and foxglove bridge plugins * fix Windows MSVC wasmer linking * fix: timestamp detection with array fields (#1310) * Add PlotGroup support to parsing plugins (topic/channel as group) * WebSocket dialog: dedicated Connect button, sorting, and UI polish * move to wasmer * Fix: No buttons appears / Can't select any topics (#1306) * much faster MCAP pre-loading and update to 2.1.2 * Replace StringRef with dictionary index in StringSeries. Fixes #1031 * Fix dangling StringRef pointers in StringSeries::clonePoints (#1279) * Fix WebSocket plugin: use project's zstd target instead of find_path * Fix Reset to Default Curve Style in PlotWidget (#1277) * Fix multiple bugs in rosx_introspection (ported from upstream) * WebSocket DataStreamer plugin integration (#1295) * Fix: Save colorMaps section to layout XML (#1278) * Add automatic detection and merging of separate date/time CSV columns (#1259) * Support batched array messages in JSON/CBOR/BSON/MessagePack parsers (#1285) * fix: quaternion-to-RPY toolbox streaming data loss (#1289) * Topological sorting for nested dependencies in custom equations (#1300) * Fix Parsing of DiagnosticArrays (#1297) * fix: use first available parser instead of hardcoded fallback (#1015) * fix DJS_PLUGINS_DIRECTORY in Docker build (#1281) * fix: guard undo/redo from firing during active popups (#1287) * fix merging of string series (#1298) * fix: parsing of nested topics in ulogs (#1301) * fix: Arrow 23.0.0 compatibility (#1282) * fix placeholder text color (workaround to Qt5 bug) * improve clarity of nlohmann parsers dialog * Adjust dialog size based on protocol selection * fix: inherit legend settings when splitting plot views (#1260) * Fix Conan 2.x build instructions in COMPILE.md (#1256) * Contributors: Alvvalencia, Copilot, Davide Faconti, Jeremy Elson, KIRAN, Luca Bonamini, Panav, Sachin Kumar, Simon Sagmeister, Timo Stienstra, Tobias Büchli, dependabot[bot], Øyvind Taksdal Stubhaug
3.15.0 (2025-12-27)
3.14.6 (2025-12-27)
- cherry pick #835: use timspam in protobuf, if present
- formatting
- fix style in preferences
- Feature: add option to swap pan/zoom mouse actions (#1235)
- cleanup ULG plugin
- Merge branch 'he_parse'
- fix formatting
- fix comments
- CSV parsing: fix issue #1237
- Add hexadecimal timestamp parsing (0x prefix only) Support hexadecimal values in CSV files when explicitly prefixed with 0x. This avoids ambiguity with string labels like 'A' or 'B' which could otherwise be misinterpreted as hex values. Addresses feedback from \@facontidavide on #1227
- Fix plugin installation path from /usr/OFF to /usr/lib/plotjuggler/plugins (#1239)
- Add GitHub Copilot instructions for repository context (#1242)
- add devcontainer
- should fix #1223
- formatting
- Contributors: Copilot, Davide Faconti, panav, viktor-av
3.14.5 (2025-12-22)
- add option to change width of lines in PlotWidget Editor
- fix snap build
- Contributors: Davide Faconti
3.14.4 (2025-12-19)
- change ID
- Install plugins into lib tree (#1228)
File truncated at 100 lines see the full file
Package Dependencies
| Deps | Name |
|---|---|
| catkin | |
| ament_cmake | |
| roslib | |
| roscpp | |
| ament_index_cpp | |
| rclcpp | |
| data_tamer_cpp |
System Dependencies
Dependant Packages
| Name | Deps |
|---|---|
| sr_gui_hand_calibration |
Launch files
Messages
Services
Plugins
Recent questions tagged plotjuggler at Robotics Stack Exchange
|
|
plotjuggler package from plotjuggler repoplotjuggler |
ROS Distro
|
Package Summary
| Version | 3.16.0 |
| License | MPL-2.0 |
| Build type | CATKIN |
| Use | RECOMMENDED |
Repository Summary
| Description | |
| Checkout URI | https://github.com/facontidavide/PlotJuggler.git |
| VCS Type | git |
| VCS Version | main |
| Last Updated | 2026-03-18 |
| Dev Status | DEVELOPED |
| Released | RELEASED |
| Contributing |
Help Wanted (-)
Good First Issues (-) Pull Requests to Review (-) |
Package Description
Additional Links
Maintainers
- Davide Faconti
Authors
- Davide Faconti
![]()
![]()
![]()
![]()
![]()
Gold Sponsor:
PlotJuggler 3.16
PlotJuggler is a tool to visualize time series that is fast, powerful and intuitive.
Noteworthy features:
- Simple Drag & Drop user interface.
- Load data from file.
- Connect to live streaming of data.
- Save the visualization layout and configurations to reuse them later.
- Fast OpenGL visualization.
- Can handle thousands of timeseries and millions of data points.
- Transform your data using a simple editor: derivative, moving average, integral, etc…
- PlotJuggler can be easily extended using plugins.
Data sources (file and streaming)
- Load CSV files.
- Load ULog (PX4).
- Subscribe to many different streaming sources: MQTT, WebSockets, ZeroMQ, UDP, etc.
- Understand data formats such as JSON, CBOR, BSON, Message Pack, etc.
- Well integrated with ROS: open rosbags and/or subscribe to ROS topics (both ROS1 and ROS2).
- Supports the Lab Streaming Layer, that is used by many devices.
- Easily add your custom data source and/or formats…
Transform and analyze your data
PlotJuggler makes it easy to visualize data but also to analyze it. You can manipulate your time series using a simple and extendable Transform Editor.
Alternatively, you may use the Custom Function Editor, which allows you to create Multi-input / Single-output functions using a scripting language based on Lua.
If you are not familiar with Lua, don’t be afraid, you won’t need more than 5 minutes to learn it ;)
Tutorials
To learn how to use PlotJuggler, check the tutorials here:
| Tutorial 1 | Tutorial 2 | Tutorial 3 |
|---|---|---|
|
|
|
Supported plugins
Some plugins can be found in a different repository. The individual README files should include all the information needed to compile and use the plugin.
Please submit specific issues, Pull Requests and questions on the related Github repository:
If you want a simple example to learn how to write your own plugins, have a look at PlotJuggler/plotjuggler-sample-plugins
Installation
You can download the latest ready to use binaries from the Release page.
Snap (recommended in Ubuntu, to ROS users too)
The snap contains a version of PlotJuggler that works (with some limitations) with ROS2.
To install it in Ubuntu, run:
File truncated at 100 lines see the full file
Changelog for package plotjuggler
3.16.0 (2026-03-10) -----------* add plotjuggler and foxglove bridge plugins * fix Windows MSVC wasmer linking * fix: timestamp detection with array fields (#1310) * Add PlotGroup support to parsing plugins (topic/channel as group) * WebSocket dialog: dedicated Connect button, sorting, and UI polish * move to wasmer * Fix: No buttons appears / Can't select any topics (#1306) * much faster MCAP pre-loading and update to 2.1.2 * Replace StringRef with dictionary index in StringSeries. Fixes #1031 * Fix dangling StringRef pointers in StringSeries::clonePoints (#1279) * Fix WebSocket plugin: use project's zstd target instead of find_path * Fix Reset to Default Curve Style in PlotWidget (#1277) * Fix multiple bugs in rosx_introspection (ported from upstream) * WebSocket DataStreamer plugin integration (#1295) * Fix: Save colorMaps section to layout XML (#1278) * Add automatic detection and merging of separate date/time CSV columns (#1259) * Support batched array messages in JSON/CBOR/BSON/MessagePack parsers (#1285) * fix: quaternion-to-RPY toolbox streaming data loss (#1289) * Topological sorting for nested dependencies in custom equations (#1300) * Fix Parsing of DiagnosticArrays (#1297) * fix: use first available parser instead of hardcoded fallback (#1015) * fix DJS_PLUGINS_DIRECTORY in Docker build (#1281) * fix: guard undo/redo from firing during active popups (#1287) * fix merging of string series (#1298) * fix: parsing of nested topics in ulogs (#1301) * fix: Arrow 23.0.0 compatibility (#1282) * fix placeholder text color (workaround to Qt5 bug) * improve clarity of nlohmann parsers dialog * Adjust dialog size based on protocol selection * fix: inherit legend settings when splitting plot views (#1260) * Fix Conan 2.x build instructions in COMPILE.md (#1256) * Contributors: Alvvalencia, Copilot, Davide Faconti, Jeremy Elson, KIRAN, Luca Bonamini, Panav, Sachin Kumar, Simon Sagmeister, Timo Stienstra, Tobias Büchli, dependabot[bot], Øyvind Taksdal Stubhaug
3.15.0 (2025-12-27)
3.14.6 (2025-12-27)
- cherry pick #835: use timspam in protobuf, if present
- formatting
- fix style in preferences
- Feature: add option to swap pan/zoom mouse actions (#1235)
- cleanup ULG plugin
- Merge branch 'he_parse'
- fix formatting
- fix comments
- CSV parsing: fix issue #1237
- Add hexadecimal timestamp parsing (0x prefix only) Support hexadecimal values in CSV files when explicitly prefixed with 0x. This avoids ambiguity with string labels like 'A' or 'B' which could otherwise be misinterpreted as hex values. Addresses feedback from \@facontidavide on #1227
- Fix plugin installation path from /usr/OFF to /usr/lib/plotjuggler/plugins (#1239)
- Add GitHub Copilot instructions for repository context (#1242)
- add devcontainer
- should fix #1223
- formatting
- Contributors: Copilot, Davide Faconti, panav, viktor-av
3.14.5 (2025-12-22)
- add option to change width of lines in PlotWidget Editor
- fix snap build
- Contributors: Davide Faconti
3.14.4 (2025-12-19)
- change ID
- Install plugins into lib tree (#1228)
File truncated at 100 lines see the full file
Package Dependencies
| Deps | Name |
|---|---|
| catkin | |
| ament_cmake | |
| roslib | |
| roscpp | |
| ament_index_cpp | |
| rclcpp | |
| data_tamer_cpp |
System Dependencies
Dependant Packages
| Name | Deps |
|---|---|
| plotjuggler_ros |