 ROS Index

|
ros2_pulse package from ros2_pulse reporos2_pulse |
ROS Distro
|
Package Summary
| Version | 0.7.0 |
| License | Apache-2.0 |
| Build type | AMENT_CMAKE |
| Use | RECOMMENDED |
Repository Summary
| Description | |
| Checkout URI | https://github.com/TanayK07/ros2_pulse.git |
| VCS Type | git |
| VCS Version | main |
| Last Updated | 2026-10-31 |
| Dev Status | DEVELOPED |
| Released | RELEASED |
| Contributing |
Help Wanted (-)
Good First Issues (-) Pull Requests to Review (-) |
Package Description
Additional Links
Maintainers
- Tanay Kedia
Authors
ros2_pulse
The heartbeat of your ROS 2 graph. A low-overhead probe that measures per-topic message rate and active-node liveness for both inter-process and intra-process traffic, on stock ROS 2 binaries, with no rebuild, no privileges and no network traffic. The counting hot path costs under a nanosecond per message; the whole probe costs about 2 % of workload CPU on a harsh 4,900 msg/s stress and less on real graphs.




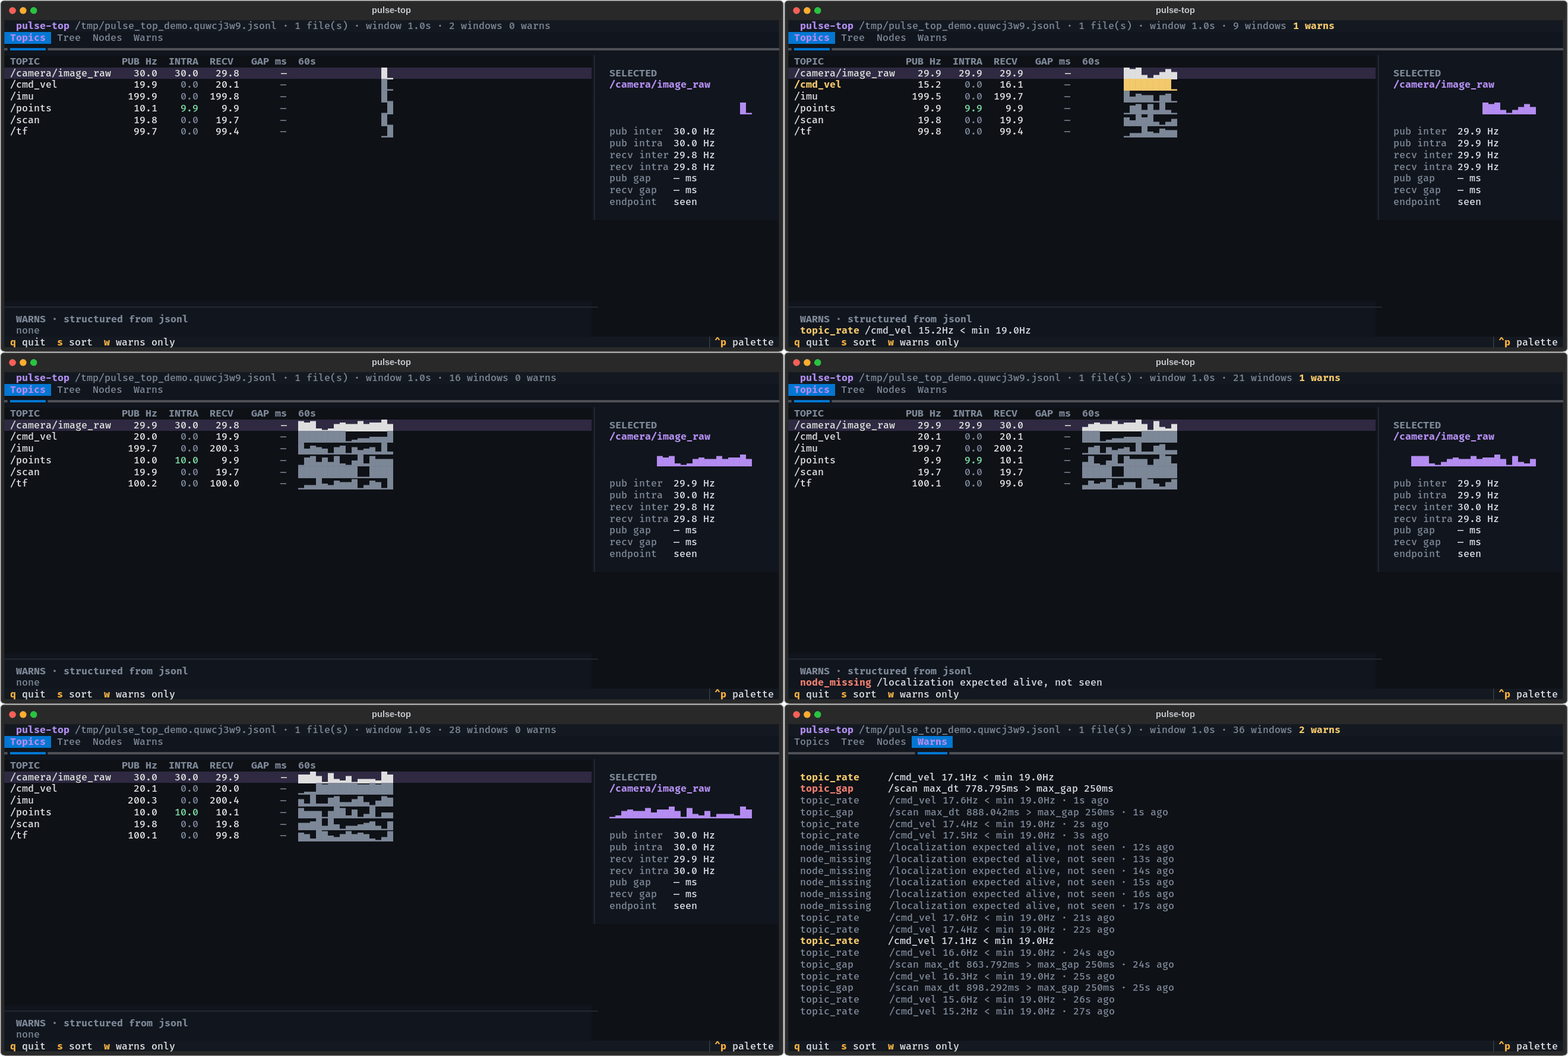
pulse-top --demo: the probe’s log, live. Sparklines per topic, intra-process rates, structured warnings with ages. Install: pipx install ros2-pulse-top (details).
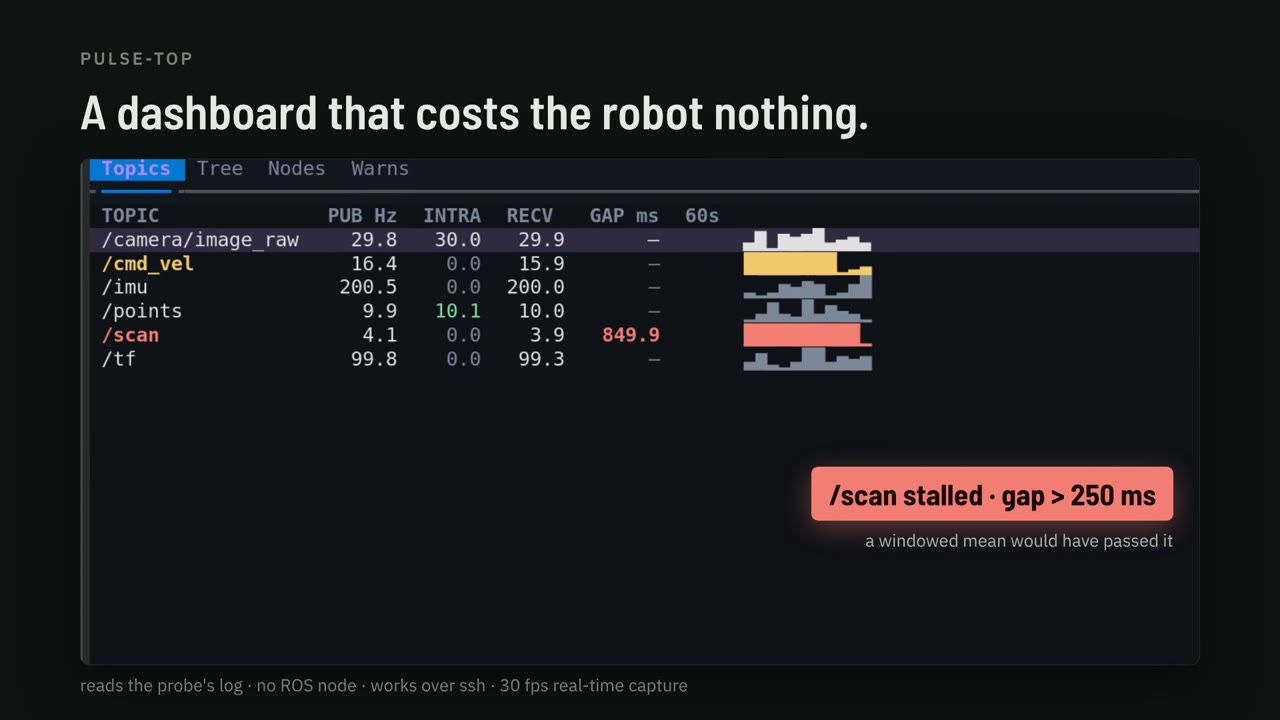
Forty seconds on what watching a topic costs and what the probe does instead. Watch the video (40 s, YouTube) or read the docs.
The long version, for systems programmers: Watching a ROS 2 topic changes it, the observer-effect measurement and the symbol-interposition trick that avoids it.
Why
The question in production is simple: is every topic flowing at the rate it should, and which nodes are alive? The existing tools each fall short of answering it.
-
ros2 topic hzandros2 topic echosubscribe to one topic at a time. Watching a single 100 KB topic costs 7 % of a core withhzand 31 % withecho, they cannot see intra-process messages at all, and pointinghzat an intra-process topic makes the publisher start serializing every message, which raised the watched process’s CPU by 52 % in our measurements. - Built-in topic statistics are
bypassed by intra-process comms on Humble-class
binaries, so composable nodes carrying point clouds lose all introspection. This is fixed on
rollingby rclcpp#3130 (merged April 2026), but rclcpp#3203 (merged October 2026) then removed the built-in statistics publisher fromrollingaltogether, so the next distro will not ship it.pulse_bridgepublishes the same/statisticsmessages without it. -
ros2_tracing/ LTTng is built for offline analysis: a session daemon plus post-processing of a CTF trace just to get a rate. On Humble it also needs ROS rebuilt with the lttng-ust backend (Jazzy and newer trace out of the box). - CARET (Tier IV) uses the same hook layer as this probe, LD_PRELOAD over tracetools, which is a useful independent validation of the mechanism. It is built for deep offline latency and chain analysis and needs LTTng, a forked rclcpp and Jupyter post-processing. Complementary, not always-on.
- eBPF uprobes need
CAP_SYS_ADMIN, debugfs and a kernel with BTF and uprobes, which is often a non-starter on Jetson and other embedded targets, and they pay a kernel trap per message.
ros2_pulse hooks the tracetools instrumentation layer that rclcpp already calls on every
publish and every callback, counts in-process with a lock-free hot path, and writes ready-to-read
Hz to a small rolling file.
What you get
# ts_ns=1782887153899445923 window_s=5.000
TOPIC /scan 20.000000                      # publish-side, inter-process
PUB   /points inter=0.000000 intra=30.000000   # publish-side incl. intra (Iron+)
RECV  /scan inter=20.000000 intra=0.000000 # receive-side, BOTH transports
RECV  /points inter=0.000000 intra=30.000000   # <- intra-process, invisible to other tools on Humble
JITTER /scan recv max_dt_ms=21.284             # largest inter-arrival gap (opt-in, see below)
LOAN  /cloud pub hz=30.000000                  # middleware-loaned share of the publishes (see below)
NODE  /perception
NODE  /planner
WARN  TOPIC /scan hz=1.200000 expected=[18,22]  # only with an expected-rate spec (see below)
If a sidecar exporter or a log shipper is reading instead of a person, ROS_TOPIC_STATS_FORMAT=jsonl
writes every window as one JSON object per line with the same gates and values. See
JSON Lines output. Dashboards that already
read rclcpp’s built-in topic statistics (removed in rolling by
rclcpp#3203) get the same numbers on /statistics
from the pulse_bridge sidecar, and Prometheus, OTLP and
Grafana get them from pulse-export.
How it works
libros2_pulse.so is injected with LD_PRELOAD. It exports the same symbols as
libtracetools.so’s tracepoint API (ros_trace_rcl_publish, ros_trace_callback_start, the
init tracepoints and so on). The dynamic linker binds rclcpp’s calls to ours first; each
interposer records a stat and forwards to the real function through dlsym(RTLD_NEXT, ...).
rclcpp calls these functions unconditionally (the LTTng enable check is inside them), so the
probe works with no tracing session and adds no DDS traffic.
- Intra-process visibility comes from
callback_start(callback, is_intra_process), which fires for every subscription callback regardless of transport. - Every publisher handle and every subscription handle has its own counter, attributed to the
node that created it (
rcl_publisher_init/rcl_subscription_initcarry the node handle,rcl_node_initnames it). The per-topicTOPIC/RECVrates are summed from those at flush time, and the per-endpoint split is written too (see Per-node, per-endpoint breakdown). - The hot path is a per-endpoint relaxed atomic increment behind a 256-slot thread-local cache with a stride-breaking hash. No global lock, no per-message string hashing. Counting costs about 0.3 ns/op on a fixed endpoint and 0.6 to 1.2 ns/op alternating across a working set on the reference box, two orders of magnitude under a single LTTng-UST tracepoint (about 158 ns).
File truncated at 100 lines see the full file
Changelog
All notable changes to this project are documented here. Format follows Keep a Changelog; versions follow SemVer.
[Unreleased]
Changed
-
pulse-export listens on port 10060 by default, not 9464. The
Prometheus default-port list
gives 9464 to the OpenTelemetry Node.js exporter, so the two could not run on one host with
their defaults. The exporter range 9100-9999 is full, and 10060 is the next free port in the
10000+ block that continues it. To keep an existing scrape config, pass
--port 9464.examples/grafana/now publishes and scrapes 10060. A changed default, so this ships in a minor pulse-top release (0.7.0), not a patch. -
pulse-top 0.6.1: Textual floor lowered from 8.2.7 to 2.0 (issue #71). Every Textual from 4.1
on requires pygments>=2.19.2, so on Ubuntu 24.04
pip install --break-system-packagesreplaced Debian’s python3-pygments (2.17.2). Textual 2.0 to 4.0 need only rich>=13.3.3, which Debian’s python3-rich (13.7.1) satisfies; install with"textual<4.1"there to keep both. The terminal theme falls back to Textual’s pre-8.2.5 name for it (textual-ansi). CI runs the suite on the floor and on the Ubuntu 24.04 set as well as on the latest Textual. -
pulse-top installs with pipx in the docs. pulse-top imports nothing from ROS, so the README,
the docs.ros.org guide and docs/EXPORT.md now lead with
pipx install ros2-pulse-top(in apt on 22.04 and 24.04), withuv tool install, aros:<distro>container recipe and the capped system-pip line as alternatives, instead of a barepip3 install.
Added
-
Prometheus alerting rules for pulse-export in
examples/prometheus/ros2_pulse_alerts.yml: the probe’stopic_rate,topic_gapandnode_missingwarns, a warn that keeps coming back (info), arecv_lagdeficit, a topic that stopped publishing while its process still writes windows, a process that stopped writing windows (warning), and pulse-export itself down.ros2_pulse_alerts_test.ymltests them on synthetic series, and a new CI job runspromtool check rulesandpromtool test rules(Prometheus 3.5.0) and checks the compose example’s config. A pytest checks every metric and label the rules use against pulse-export’s metric catalogue.examples/grafana/loads the rules and evaluates them every 5 s. docs/EXPORT.md has a new Alerting section.
Fixed
-
pulse-export no longer scrapes logs of exited processes as live. The follower replays every
matching log on attach and the probe never deletes its log, so on each start pulse-export
exported one leftover
topic_freq.<pid>.logper process of every earlier run with its last rates and an age of 0, until it forgot them five minutes later. It now skips a log whose mtime is older than the forget horizon (--oncestill reads any log). It also forgets a process on its jsonl exit window ("partial": trueafter another window), as pulse_bridge’s/diagnosticsalready did, and keeps a process for four window periods when that is longer than five minutes, so a slow window is not forgotten between two flushes. -
pulse-export no longer repeats a
ros2_pulse_warn_activeseries in one scrape. The probe’s warns carry no side or transport, so a spec with apuband arecvrule on one topic (or an inter and an intra one) that both warned in a window gave two samples with the same labels, and Prometheus rejects a scrape with a duplicate series. Each label set is now one sample, in the scrape and in the OTLP push, andros2_pulse_warns_totalstill counts every warn read. A node listed twice in the spec’snodes:did the same towarn_activeandnode_up. - examples/grafana/README.md said the probe must log jsonl. pulse-export reads the default text format too.
[0.7.0] - 2026-10-21
/diagnostics for diagnostic_aggregator, the rest of rclcpp’s removed topic statistics (MINIMUM, STDDEV, message_age), graph-monitor messages, per-endpoint counts, and a package guide on docs.ros.org. pulse-top 0.6.0 reads the endpoint fields.
Changed
-
The probe counts per publisher and per subscription, attributed to the owning node.
Counters used to be keyed by topic per process, so every endpoint of a topic in one process
shared one counter. Two subscriptions on one topic (a component container, or one node
subscribing twice) interleaved one inter-arrival stream, two subscriptions of one node summed
into one rate, and every node’s
/rosoutand/parameter_eventsendpoints shared one counter, so one node’s log line kept every node of the process in theNODElist (found in the #68 and #70 reviews). Each rcl publisher handle and rcl subscription handle now has its own counter, attributed to the node whose handle its init carried (including the/rosoutpublisher rcl creates beforercl_node_init’s tracepoint fires). The hot path is still one relaxed add, on the handle’s own counter; the per-topicTOPIC/PUB/RECV/LOANrates are summed at flush time and are unchanged, and the per-topicJITTERgap keeps measuring the gap between any two messages of the topic. With gap tracking on, each arrival also updates its handle’s own gap from the same clock read (one more atomic exchange). Node liveness now looks only at a node’s own endpoints. A publisher or subscription address reused after a destroy re-homes its endpoint, which also stops a recycled publisher handle from counting into its previous topic. -
Destroyed publishers, subscriptions and nodes are retired. There is no destroy tracepoint,
so the probe now also wraps
rcl_publisher_fini,rcl_subscription_finiandrcl_node_finiby name (graph-rate calls, the per-message path is unchanged). A destroyed endpoint is written once more if its last window carried traffic, then dropped; before, a subscription removed in a lifecycleon_cleanup(or by unloading a component) stayed in every window as a stalledinter=0.0endpoint of a live node, and a destroyed publisher’s open gap grew without bound with gap tracking on. A node address reused by the next node no longer hands that node the destroyed node’s endpoints: only the new node’s own pre-init/rosoutpublisher is claimed. A callback address reused by a re-created subscription is re-resolved (its endpoint is proven again for KNOWN_ISSUES #12, and counts no longer go to the destroyed subscription), and the thread-local cache is tagged by kind, so a publisher handle address reused as a subscription handle (or the reverse) is never served the other one’s endpoint (PR #72 review).
Added
-
pulse_bridgepublishes/diagnostics(diagnostics:=true). Onediagnostic_msgs/DiagnosticArrayper poll fordiagnostic_aggregator: a status per expected-rate rule (ros2_pulse: /scan (recv),WARNwhile the probe warnstopic_rateortopic_gapfor it, withhz, the rule’s bounds and the measured gap as values), per spec node (ERRORonnode_missing), and per log (ERRORstaleonce no window arrived for two window periods plus a poll; a log whose latest window is the probe’s exit window is dropped instead, a clean exit is not a fault). The levels come from the probe’swarns; the bridge reads the spec (expected_file, default$ROS_TOPIC_STATS_EXPECTED) only to know the rules, so a rule that holds reportsOK. New parameters:diagnostics,diagnostics_topic,hardware_id,diagnostics_all_topics(also report topics without a rule),expected_file.package.xmlnow declaresdiagnostic_msgs. The jsonl reader (sLogWindow::warns) now parseswarns;
File truncated at 100 lines see the full file
Package Dependencies
| Deps | Name |
|---|---|
| ament_cmake | |
| ament_cmake_gtest | |
| ament_cmake_pytest | |
| rcl | |
| rclpy | |
| std_msgs | |
| ros2run | |
| rclcpp | |
| statistics_msgs | |
| diagnostic_msgs | |
| rosgraph_monitor_msgs |
System Dependencies
| Name |
|---|
| lttng-tools |
Dependant Packages
Launch files
Messages
Services
Plugins
Recent questions tagged ros2_pulse at Robotics Stack Exchange
|
|
ros2_pulse package from ros2_pulse reporos2_pulse |
ROS Distro
|
Package Summary
| Version | 0.7.0 |
| License | Apache-2.0 |
| Build type | AMENT_CMAKE |
| Use | RECOMMENDED |
Repository Summary
| Description | |
| Checkout URI | https://github.com/TanayK07/ros2_pulse.git |
| VCS Type | git |
| VCS Version | main |
| Last Updated | 2026-10-31 |
| Dev Status | DEVELOPED |
| Released | RELEASED |
| Contributing |
Help Wanted (-)
Good First Issues (-) Pull Requests to Review (-) |
Package Description
Additional Links
Maintainers
- Tanay Kedia
Authors
ros2_pulse
The heartbeat of your ROS 2 graph. A low-overhead probe that measures per-topic message rate and active-node liveness for both inter-process and intra-process traffic, on stock ROS 2 binaries, with no rebuild, no privileges and no network traffic. The counting hot path costs under a nanosecond per message; the whole probe costs about 2 % of workload CPU on a harsh 4,900 msg/s stress and less on real graphs.
pulse-top --demo: the probe’s log, live. Sparklines per topic, intra-process rates, structured warnings with ages. Install: pipx install ros2-pulse-top (details).
Forty seconds on what watching a topic costs and what the probe does instead. Watch the video (40 s, YouTube) or read the docs.
The long version, for systems programmers: Watching a ROS 2 topic changes it, the observer-effect measurement and the symbol-interposition trick that avoids it.
Why
The question in production is simple: is every topic flowing at the rate it should, and which nodes are alive? The existing tools each fall short of answering it.
-
ros2 topic hzandros2 topic echosubscribe to one topic at a time. Watching a single 100 KB topic costs 7 % of a core withhzand 31 % withecho, they cannot see intra-process messages at all, and pointinghzat an intra-process topic makes the publisher start serializing every message, which raised the watched process’s CPU by 52 % in our measurements. - Built-in topic statistics are
bypassed by intra-process comms on Humble-class
binaries, so composable nodes carrying point clouds lose all introspection. This is fixed on
rollingby rclcpp#3130 (merged April 2026), but rclcpp#3203 (merged October 2026) then removed the built-in statistics publisher fromrollingaltogether, so the next distro will not ship it.pulse_bridgepublishes the same/statisticsmessages without it. -
ros2_tracing/ LTTng is built for offline analysis: a session daemon plus post-processing of a CTF trace just to get a rate. On Humble it also needs ROS rebuilt with the lttng-ust backend (Jazzy and newer trace out of the box). - CARET (Tier IV) uses the same hook layer as this probe, LD_PRELOAD over tracetools, which is a useful independent validation of the mechanism. It is built for deep offline latency and chain analysis and needs LTTng, a forked rclcpp and Jupyter post-processing. Complementary, not always-on.
- eBPF uprobes need
CAP_SYS_ADMIN, debugfs and a kernel with BTF and uprobes, which is often a non-starter on Jetson and other embedded targets, and they pay a kernel trap per message.
ros2_pulse hooks the tracetools instrumentation layer that rclcpp already calls on every
publish and every callback, counts in-process with a lock-free hot path, and writes ready-to-read
Hz to a small rolling file.
What you get
# ts_ns=1782887153899445923 window_s=5.000
TOPIC /scan 20.000000                      # publish-side, inter-process
PUB   /points inter=0.000000 intra=30.000000   # publish-side incl. intra (Iron+)
RECV  /scan inter=20.000000 intra=0.000000 # receive-side, BOTH transports
RECV  /points inter=0.000000 intra=30.000000   # <- intra-process, invisible to other tools on Humble
JITTER /scan recv max_dt_ms=21.284             # largest inter-arrival gap (opt-in, see below)
LOAN  /cloud pub hz=30.000000                  # middleware-loaned share of the publishes (see below)
NODE  /perception
NODE  /planner
WARN  TOPIC /scan hz=1.200000 expected=[18,22]  # only with an expected-rate spec (see below)
If a sidecar exporter or a log shipper is reading instead of a person, ROS_TOPIC_STATS_FORMAT=jsonl
writes every window as one JSON object per line with the same gates and values. See
JSON Lines output. Dashboards that already
read rclcpp’s built-in topic statistics (removed in rolling by
rclcpp#3203) get the same numbers on /statistics
from the pulse_bridge sidecar, and Prometheus, OTLP and
Grafana get them from pulse-export.
How it works
libros2_pulse.so is injected with LD_PRELOAD. It exports the same symbols as
libtracetools.so’s tracepoint API (ros_trace_rcl_publish, ros_trace_callback_start, the
init tracepoints and so on). The dynamic linker binds rclcpp’s calls to ours first; each
interposer records a stat and forwards to the real function through dlsym(RTLD_NEXT, ...).
rclcpp calls these functions unconditionally (the LTTng enable check is inside them), so the
probe works with no tracing session and adds no DDS traffic.
- Intra-process visibility comes from
callback_start(callback, is_intra_process), which fires for every subscription callback regardless of transport. - Every publisher handle and every subscription handle has its own counter, attributed to the
node that created it (
rcl_publisher_init/rcl_subscription_initcarry the node handle,rcl_node_initnames it). The per-topicTOPIC/RECVrates are summed from those at flush time, and the per-endpoint split is written too (see Per-node, per-endpoint breakdown). - The hot path is a per-endpoint relaxed atomic increment behind a 256-slot thread-local cache with a stride-breaking hash. No global lock, no per-message string hashing. Counting costs about 0.3 ns/op on a fixed endpoint and 0.6 to 1.2 ns/op alternating across a working set on the reference box, two orders of magnitude under a single LTTng-UST tracepoint (about 158 ns).
File truncated at 100 lines see the full file
Changelog
All notable changes to this project are documented here. Format follows Keep a Changelog; versions follow SemVer.
[Unreleased]
Changed
-
pulse-export listens on port 10060 by default, not 9464. The
Prometheus default-port list
gives 9464 to the OpenTelemetry Node.js exporter, so the two could not run on one host with
their defaults. The exporter range 9100-9999 is full, and 10060 is the next free port in the
10000+ block that continues it. To keep an existing scrape config, pass
--port 9464.examples/grafana/now publishes and scrapes 10060. A changed default, so this ships in a minor pulse-top release (0.7.0), not a patch. -
pulse-top 0.6.1: Textual floor lowered from 8.2.7 to 2.0 (issue #71). Every Textual from 4.1
on requires pygments>=2.19.2, so on Ubuntu 24.04
pip install --break-system-packagesreplaced Debian’s python3-pygments (2.17.2). Textual 2.0 to 4.0 need only rich>=13.3.3, which Debian’s python3-rich (13.7.1) satisfies; install with"textual<4.1"there to keep both. The terminal theme falls back to Textual’s pre-8.2.5 name for it (textual-ansi). CI runs the suite on the floor and on the Ubuntu 24.04 set as well as on the latest Textual. -
pulse-top installs with pipx in the docs. pulse-top imports nothing from ROS, so the README,
the docs.ros.org guide and docs/EXPORT.md now lead with
pipx install ros2-pulse-top(in apt on 22.04 and 24.04), withuv tool install, aros:<distro>container recipe and the capped system-pip line as alternatives, instead of a barepip3 install.
Added
-
Prometheus alerting rules for pulse-export in
examples/prometheus/ros2_pulse_alerts.yml: the probe’stopic_rate,topic_gapandnode_missingwarns, a warn that keeps coming back (info), arecv_lagdeficit, a topic that stopped publishing while its process still writes windows, a process that stopped writing windows (warning), and pulse-export itself down.ros2_pulse_alerts_test.ymltests them on synthetic series, and a new CI job runspromtool check rulesandpromtool test rules(Prometheus 3.5.0) and checks the compose example’s config. A pytest checks every metric and label the rules use against pulse-export’s metric catalogue.examples/grafana/loads the rules and evaluates them every 5 s. docs/EXPORT.md has a new Alerting section.
Fixed
-
pulse-export no longer scrapes logs of exited processes as live. The follower replays every
matching log on attach and the probe never deletes its log, so on each start pulse-export
exported one leftover
topic_freq.<pid>.logper process of every earlier run with its last rates and an age of 0, until it forgot them five minutes later. It now skips a log whose mtime is older than the forget horizon (--oncestill reads any log). It also forgets a process on its jsonl exit window ("partial": trueafter another window), as pulse_bridge’s/diagnosticsalready did, and keeps a process for four window periods when that is longer than five minutes, so a slow window is not forgotten between two flushes. -
pulse-export no longer repeats a
ros2_pulse_warn_activeseries in one scrape. The probe’s warns carry no side or transport, so a spec with apuband arecvrule on one topic (or an inter and an intra one) that both warned in a window gave two samples with the same labels, and Prometheus rejects a scrape with a duplicate series. Each label set is now one sample, in the scrape and in the OTLP push, andros2_pulse_warns_totalstill counts every warn read. A node listed twice in the spec’snodes:did the same towarn_activeandnode_up. - examples/grafana/README.md said the probe must log jsonl. pulse-export reads the default text format too.
[0.7.0] - 2026-10-21
/diagnostics for diagnostic_aggregator, the rest of rclcpp’s removed topic statistics (MINIMUM, STDDEV, message_age), graph-monitor messages, per-endpoint counts, and a package guide on docs.ros.org. pulse-top 0.6.0 reads the endpoint fields.
Changed
-
The probe counts per publisher and per subscription, attributed to the owning node.
Counters used to be keyed by topic per process, so every endpoint of a topic in one process
shared one counter. Two subscriptions on one topic (a component container, or one node
subscribing twice) interleaved one inter-arrival stream, two subscriptions of one node summed
into one rate, and every node’s
/rosoutand/parameter_eventsendpoints shared one counter, so one node’s log line kept every node of the process in theNODElist (found in the #68 and #70 reviews). Each rcl publisher handle and rcl subscription handle now has its own counter, attributed to the node whose handle its init carried (including the/rosoutpublisher rcl creates beforercl_node_init’s tracepoint fires). The hot path is still one relaxed add, on the handle’s own counter; the per-topicTOPIC/PUB/RECV/LOANrates are summed at flush time and are unchanged, and the per-topicJITTERgap keeps measuring the gap between any two messages of the topic. With gap tracking on, each arrival also updates its handle’s own gap from the same clock read (one more atomic exchange). Node liveness now looks only at a node’s own endpoints. A publisher or subscription address reused after a destroy re-homes its endpoint, which also stops a recycled publisher handle from counting into its previous topic. -
Destroyed publishers, subscriptions and nodes are retired. There is no destroy tracepoint,
so the probe now also wraps
rcl_publisher_fini,rcl_subscription_finiandrcl_node_finiby name (graph-rate calls, the per-message path is unchanged). A destroyed endpoint is written once more if its last window carried traffic, then dropped; before, a subscription removed in a lifecycleon_cleanup(or by unloading a component) stayed in every window as a stalledinter=0.0endpoint of a live node, and a destroyed publisher’s open gap grew without bound with gap tracking on. A node address reused by the next node no longer hands that node the destroyed node’s endpoints: only the new node’s own pre-init/rosoutpublisher is claimed. A callback address reused by a re-created subscription is re-resolved (its endpoint is proven again for KNOWN_ISSUES #12, and counts no longer go to the destroyed subscription), and the thread-local cache is tagged by kind, so a publisher handle address reused as a subscription handle (or the reverse) is never served the other one’s endpoint (PR #72 review).
Added
-
pulse_bridgepublishes/diagnostics(diagnostics:=true). Onediagnostic_msgs/DiagnosticArrayper poll fordiagnostic_aggregator: a status per expected-rate rule (ros2_pulse: /scan (recv),WARNwhile the probe warnstopic_rateortopic_gapfor it, withhz, the rule’s bounds and the measured gap as values), per spec node (ERRORonnode_missing), and per log (ERRORstaleonce no window arrived for two window periods plus a poll; a log whose latest window is the probe’s exit window is dropped instead, a clean exit is not a fault). The levels come from the probe’swarns; the bridge reads the spec (expected_file, default$ROS_TOPIC_STATS_EXPECTED) only to know the rules, so a rule that holds reportsOK. New parameters:diagnostics,diagnostics_topic,hardware_id,diagnostics_all_topics(also report topics without a rule),expected_file.package.xmlnow declaresdiagnostic_msgs. The jsonl reader (sLogWindow::warns) now parseswarns;
File truncated at 100 lines see the full file
Package Dependencies
| Deps | Name |
|---|---|
| ament_cmake | |
| ament_cmake_gtest | |
| ament_cmake_pytest | |
| rcl | |
| rclpy | |
| std_msgs | |
| ros2run | |
| rclcpp | |
| statistics_msgs | |
| diagnostic_msgs | |
| rosgraph_monitor_msgs |
System Dependencies
| Name |
|---|
| lttng-tools |