
Package Summary
| Version | 0.6.0 |
| License | Apache License 2.0 |
| Build type | AMENT_PYTHON |
| Use | RECOMMENDED |
Repository Summary
| Description | |
| Checkout URI | https://github.com/autowarefoundation/autoware_tools.git |
| VCS Type | git |
| VCS Version | main |
| Last Updated | 2026-03-16 |
| Dev Status | UNKNOWN |
| Released | UNRELEASED |
| Contributing |
Help Wanted (-)
Good First Issues (-) Pull Requests to Review (-) |
Package Description
Maintainers
- Yukinari Hisaki
- Satoshi Ota
- Kosuke Takeuchi
- Shintaro Sakoda
- Fumiya Watanabe
Authors
Autoware Debug Tools
This package provides tools for debugging Autoware.
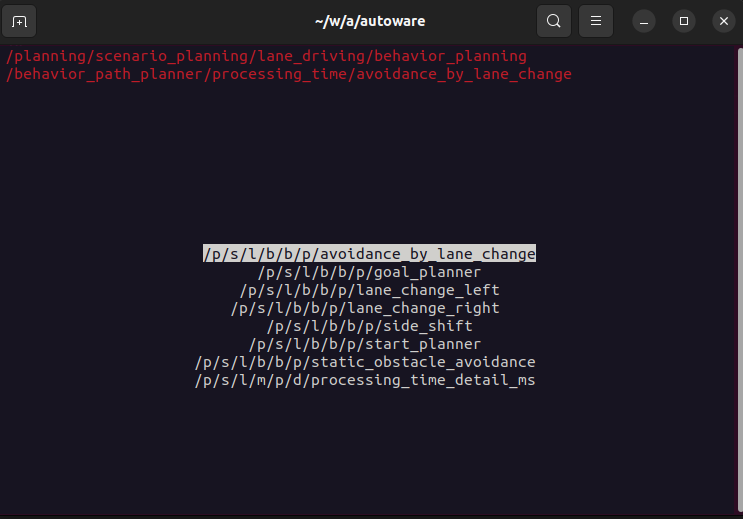
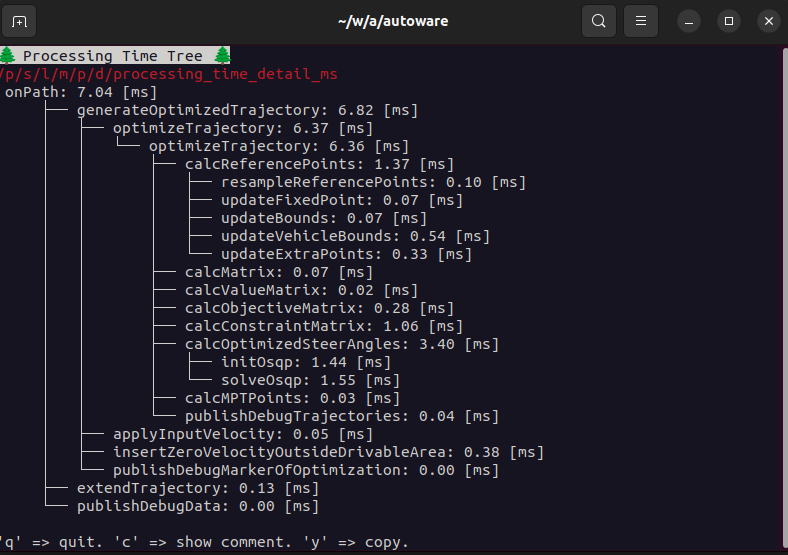
Processing Time Visualizer
This tool visualizes tier4_debug_msgs/msg/ProcessingTimeTree messages.
Usage
- Run the following command to start the visualizer.
ros2 run autoware_debug_tools processing_time_visualizer
-
Select a topic to visualize.
-
Then, the visualizer will show the processing time tree.
summarized output
Running with --summarize, it will output the summarized information.
> ros2 run autoware_debug_tools processing_time_visualizer --summarize

objectsCallback: 17.99 [ms], run count: 1
    ├── removeStaleTrafficLightInfo: 0.00 [ms], run count: 1
    ├── updateObjectData: 0.03 [ms], run count: 13
    ├── getCurrentLanelets: 4.81 [ms], run count: 13
    │   ├── checkCloseLaneletCondition: 2.43 [ms], run count: 130
    │   ├── isDuplicated: 0.02 [ms], run count: 17
    │   └── calculateLocalLikelihood: 0.66 [ms], run count: 12
    ├── updateRoadUsersHistory: 0.30 [ms], run count: 13
    └── getPredictedReferencePath: 5.47 [ms], run count: 5
        ├── predictObjectManeuver: 0.40 [ms], run count: 5
        │   └── predictObjectManeuverByLatDiffDistance: 0.34 [ms], run count: 5
        │       └── calcRightLateralOffset: 0.03 [ms], run count: 12
        ├── calculateManeuverProbability: 0.01 [ms], run count: 5
        └── addReferencePaths: 4.66 [ms], run count: 15
            ├── updateFuturePossibleLanelets: 0.08 [ms], run count: 8
            └── convertPathType: 4.29 [ms], run count: 8
System Usage Monitor
The purpose of the System Usage Monitor is to monitor, visualize and publish the CPU usage and memory usage of the ROS processes. By providing a real-time terminal-based visualization, users can easily confirm the cpu and memory usage as in the picture below.
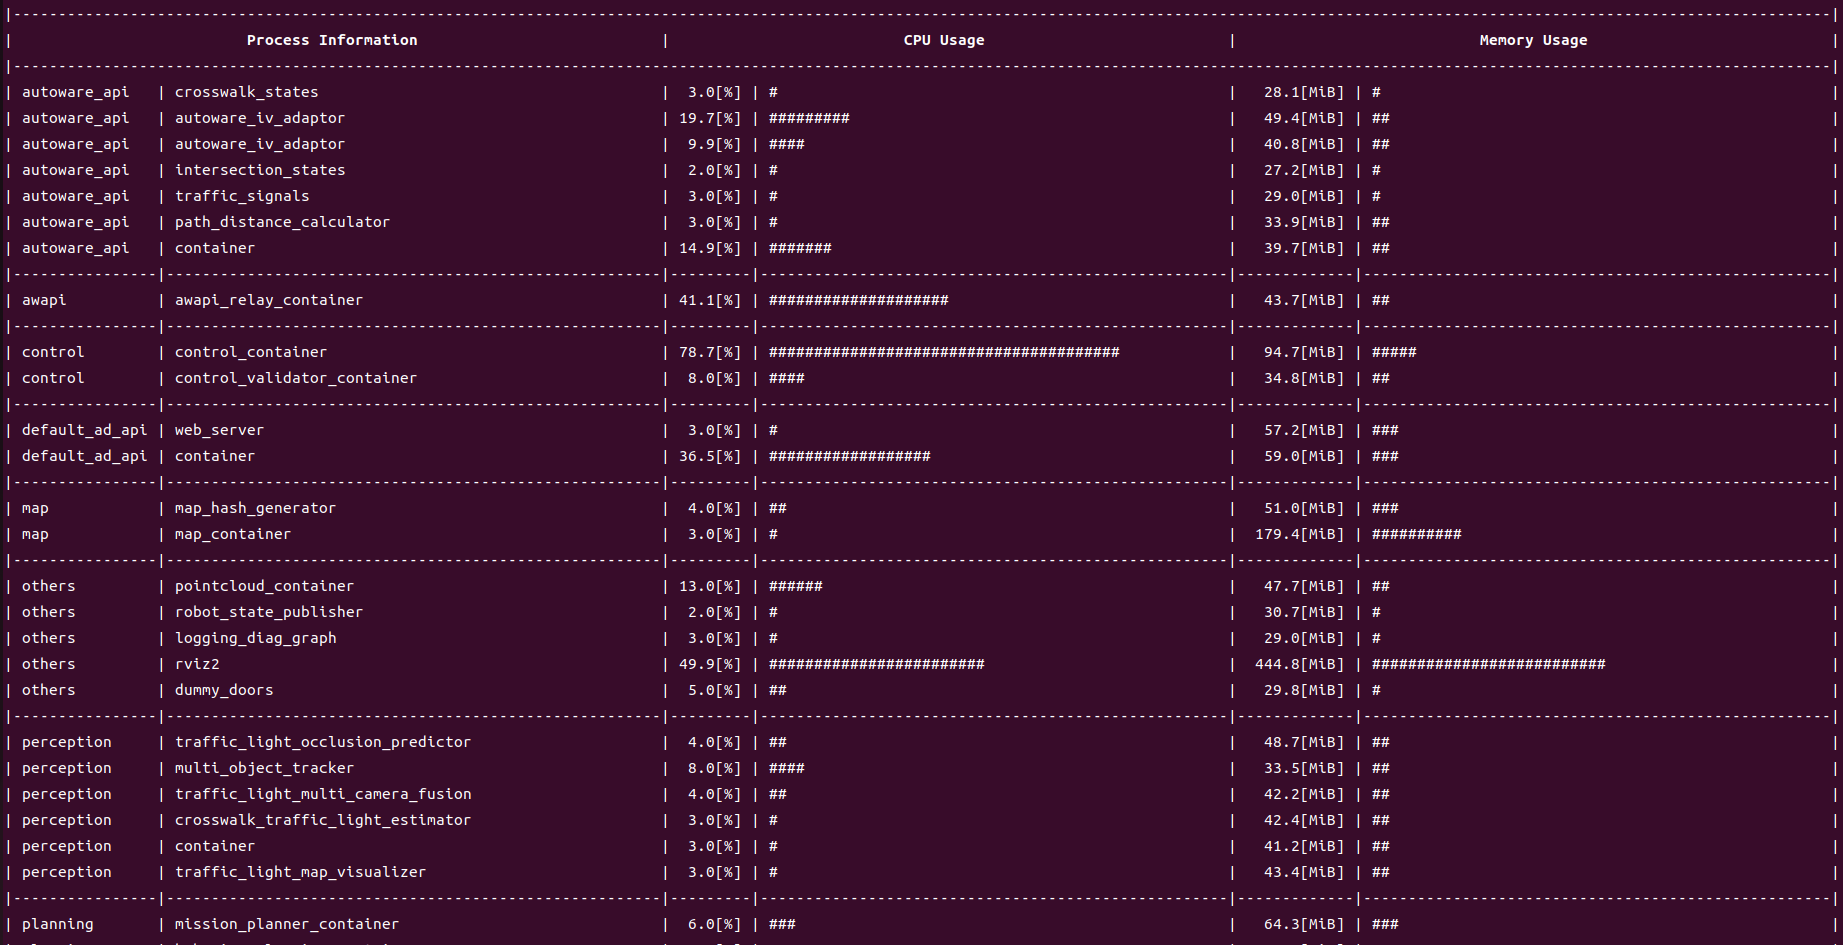
You can run the program by the following command.
ros2 run autoware_debug_tools system_usage_monitor
System Performance Plotter
This script plots the following metrics by each Autoware’s module.
- processing time
- CPU usage
- memory usage
Usage
Run the following commands according to your purpose.
# plot processing time
ros2 run autoware_debug_tools processing_time_plotter <bag-path>

# plot CPU usage
ros2 run autoware_debug_tools cpu_usage_plotter <bag-path>

# plot memory usage
ros2 run autoware_debug_tools memory_usage_plotter <bag-path>
There are several options.
-
-c:- can filter modules in the specific component (e.g.
all,planning,system, etc).
- can filter modules in the specific component (e.g.
-
-n <number>:- can pick up top
<number>critical modules.
- can pick up top
-
-g <text>- can filter the modules which include
<text>.
- can filter the modules which include
-
-y <val>- can set the height of the plot to
<val>.
- can set the height of the plot to
Examples
```bash
ros2 run autoware_debug_tools processing_time_plotter
File truncated at 100 lines see the full file
Changelog for package autoware_debug_tools
0.6.0 (2026-02-14)
0.5.0 (2025-12-30)
0.4.0 (2025-11-16)
- chore(autoware_debug_tools): ignore log in frequent_log_checker (#276)
- Contributors: Takayuki Murooka
0.3.0 (2025-08-11)
-
style(pre-commit): autofix (#275)
- apply pre-commit
* fix: add maintainer in planning_debug tools package.xml ---------
-
fix(frequent_log_checker): print the largest number of each frequent log (#228)
-
Contributors: Kyoichi Sugahara, Takayuki Murooka
0.2.0 (2025-03-24)
-
fix(autoware_debug_tools): time keeper does not work with the old message type (#224)
- fix(autoware_debug_tools): TimeKeeper does not work with the old message type
* fix typo ---------
-
feat(autoware_debug_tools): add frequent_log_checker.py (#172)
- feat(autoware_debug_tools): add frequent_log_checker.py
- minor change
* minor fix ---------Co-authored-by: SakodaShintaro <<rgbygscrsedppbwg@gmail.com>>
-
Contributors: Takayuki Murooka
0.1.0 (2025-01-28)
-
feat: use autoware_internal_debug_msgs in processing_time_plotter.py (#184)
- feat: use autoware_internal_debug_msgs in processing_time_plotter.py
- fix typo: argment -> argument
* fix typo: LINESTYLES -> LINE_STYLES ---------
-
chore: sync files (#11) Co-authored-by: github-actions <<github-actions@github.com>> Co-authored-by: pre-commit-ci[bot] <66853113+pre-commit-ci[bot]@users.noreply.github.com>
-
feat(autoware_debug_tools): add rosout_log_reconstructor.py (#160)
- feat(autoware_debug_tools): add rosout_log_reconstructor.py
* update README.md ---------
-
fix: to plot "exe_time_ms" of ndt_scan_matcher (#161)
- Fixed to plot "exe_time_ms" of ndt_scan_matcher
* style(pre-commit): autofix ---------Co-authored-by: pre-commit-ci[bot] <66853113+pre-commit-ci[bot]@users.noreply.github.com>
-
Added maintainers (#162)
-
feat(autoware_debug_tools): add topic connection checker (#132)
- feat: add topic connection checker, first commit as a proposal
- style(pre-commit): autofix
- implement diagnostic based topic settings; implement the topic localization
- temp
- refactor the codes
- add readme for topic connection checker
- test with debug
- style(pre-commit): autofix
- fix flake8
- ignore rviz2 node, ignore hyper-linked files
File truncated at 100 lines see the full file
Dependant Packages
Launch files
Messages
Services
Plugins
Recent questions tagged autoware_debug_tools at Robotics Stack Exchange
Package Summary
| Version | 0.6.0 |
| License | Apache License 2.0 |
| Build type | AMENT_PYTHON |
| Use | RECOMMENDED |
Repository Summary
| Description | |
| Checkout URI | https://github.com/autowarefoundation/autoware_tools.git |
| VCS Type | git |
| VCS Version | main |
| Last Updated | 2026-03-16 |
| Dev Status | UNKNOWN |
| Released | UNRELEASED |
| Contributing |
Help Wanted (-)
Good First Issues (-) Pull Requests to Review (-) |
Package Description
Maintainers
- Yukinari Hisaki
- Satoshi Ota
- Kosuke Takeuchi
- Shintaro Sakoda
- Fumiya Watanabe
Authors
Autoware Debug Tools
This package provides tools for debugging Autoware.
Processing Time Visualizer
This tool visualizes tier4_debug_msgs/msg/ProcessingTimeTree messages.
Usage
- Run the following command to start the visualizer.
ros2 run autoware_debug_tools processing_time_visualizer
-
Select a topic to visualize.
-
Then, the visualizer will show the processing time tree.
summarized output
Running with --summarize, it will output the summarized information.
> ros2 run autoware_debug_tools processing_time_visualizer --summarize

objectsCallback: 17.99 [ms], run count: 1
    ├── removeStaleTrafficLightInfo: 0.00 [ms], run count: 1
    ├── updateObjectData: 0.03 [ms], run count: 13
    ├── getCurrentLanelets: 4.81 [ms], run count: 13
    │   ├── checkCloseLaneletCondition: 2.43 [ms], run count: 130
    │   ├── isDuplicated: 0.02 [ms], run count: 17
    │   └── calculateLocalLikelihood: 0.66 [ms], run count: 12
    ├── updateRoadUsersHistory: 0.30 [ms], run count: 13
    └── getPredictedReferencePath: 5.47 [ms], run count: 5
        ├── predictObjectManeuver: 0.40 [ms], run count: 5
        │   └── predictObjectManeuverByLatDiffDistance: 0.34 [ms], run count: 5
        │       └── calcRightLateralOffset: 0.03 [ms], run count: 12
        ├── calculateManeuverProbability: 0.01 [ms], run count: 5
        └── addReferencePaths: 4.66 [ms], run count: 15
            ├── updateFuturePossibleLanelets: 0.08 [ms], run count: 8
            └── convertPathType: 4.29 [ms], run count: 8
System Usage Monitor
The purpose of the System Usage Monitor is to monitor, visualize and publish the CPU usage and memory usage of the ROS processes. By providing a real-time terminal-based visualization, users can easily confirm the cpu and memory usage as in the picture below.
You can run the program by the following command.
ros2 run autoware_debug_tools system_usage_monitor
System Performance Plotter
This script plots the following metrics by each Autoware’s module.
- processing time
- CPU usage
- memory usage
Usage
Run the following commands according to your purpose.
# plot processing time
ros2 run autoware_debug_tools processing_time_plotter <bag-path>

# plot CPU usage
ros2 run autoware_debug_tools cpu_usage_plotter <bag-path>

# plot memory usage
ros2 run autoware_debug_tools memory_usage_plotter <bag-path>
There are several options.
-
-c:- can filter modules in the specific component (e.g.
all,planning,system, etc).
- can filter modules in the specific component (e.g.
-
-n <number>:- can pick up top
<number>critical modules.
- can pick up top
-
-g <text>- can filter the modules which include
<text>.
- can filter the modules which include
-
-y <val>- can set the height of the plot to
<val>.
- can set the height of the plot to
Examples
```bash
ros2 run autoware_debug_tools processing_time_plotter
File truncated at 100 lines see the full file
Changelog for package autoware_debug_tools
0.6.0 (2026-02-14)
0.5.0 (2025-12-30)
0.4.0 (2025-11-16)
- chore(autoware_debug_tools): ignore log in frequent_log_checker (#276)
- Contributors: Takayuki Murooka
0.3.0 (2025-08-11)
-
style(pre-commit): autofix (#275)
- apply pre-commit
* fix: add maintainer in planning_debug tools package.xml ---------
-
fix(frequent_log_checker): print the largest number of each frequent log (#228)
-
Contributors: Kyoichi Sugahara, Takayuki Murooka
0.2.0 (2025-03-24)
-
fix(autoware_debug_tools): time keeper does not work with the old message type (#224)
- fix(autoware_debug_tools): TimeKeeper does not work with the old message type
* fix typo ---------
-
feat(autoware_debug_tools): add frequent_log_checker.py (#172)
- feat(autoware_debug_tools): add frequent_log_checker.py
- minor change
* minor fix ---------Co-authored-by: SakodaShintaro <<rgbygscrsedppbwg@gmail.com>>
-
Contributors: Takayuki Murooka
0.1.0 (2025-01-28)
-
feat: use autoware_internal_debug_msgs in processing_time_plotter.py (#184)
- feat: use autoware_internal_debug_msgs in processing_time_plotter.py
- fix typo: argment -> argument
* fix typo: LINESTYLES -> LINE_STYLES ---------
-
chore: sync files (#11) Co-authored-by: github-actions <<github-actions@github.com>> Co-authored-by: pre-commit-ci[bot] <66853113+pre-commit-ci[bot]@users.noreply.github.com>
-
feat(autoware_debug_tools): add rosout_log_reconstructor.py (#160)
- feat(autoware_debug_tools): add rosout_log_reconstructor.py
* update README.md ---------
-
fix: to plot "exe_time_ms" of ndt_scan_matcher (#161)
- Fixed to plot "exe_time_ms" of ndt_scan_matcher
* style(pre-commit): autofix ---------Co-authored-by: pre-commit-ci[bot] <66853113+pre-commit-ci[bot]@users.noreply.github.com>
-
Added maintainers (#162)
-
feat(autoware_debug_tools): add topic connection checker (#132)
- feat: add topic connection checker, first commit as a proposal
- style(pre-commit): autofix
- implement diagnostic based topic settings; implement the topic localization
- temp
- refactor the codes
- add readme for topic connection checker
- test with debug
- style(pre-commit): autofix
- fix flake8
- ignore rviz2 node, ignore hyper-linked files
File truncated at 100 lines see the full file